Recycling & baling
Reuse first, always. But a box reaches the end of its road eventually. We bale OCC to mill spec, keep contamination out, and hand you the paperwork your sustainability report needs.
Start: recycling & baling
Pre-filled for this service. Add the detail and it reaches the floor.
Before we bale anything we pull out what is still sellable. On a typical inbound stream that is around 18%, which is 18% you were about to sell for commodity pricing.
ISRI mill grade #11 and #12, moisture metered per bale, contamination logged and reported. The mill gets what it paid for, which is why we keep our outlets.
Four steps, in this order, every time.
Audit the stream
We walk your dock and separate what is still sellable from what is genuinely spent.
Equipment on site
Baler placement, compactor swaps and gaylord collection points where they make sense.
Bale to mill spec
Mill-grade #11 and #12 OCC, moisture controlled, contamination logged.
Report it
Monthly diversion statements: tonnage reused, tonnage recycled, landfill avoided.
When reuse has genuinely run out.
Everything here happens out of one building at 9869 Meeks Blvd, St. Louis. That is not a detail — it is the only reason the numbers work.
The five things that downgrade a bale.
Most of the value lost in an OCC programme is lost to contamination, not to price. All five of these are preventable at the dock for almost no money.
Moisture
The single biggest one. Wet board is heavier, which sounds good until the mill deducts for it and rejects the bale. Keep collection points under roof.
Wax coating
Wax-coated produce board cannot go into a standard OCC bale. It needs separating at source — a single pallet can downgrade a whole load.
Plastic film
Stretch wrap and poly liners bound into a bale are a rejection risk. Strip liners before the box reaches the baler.
Polystyrene and foam
Void fill left inside boxes is the most common avoidable contaminant we find. A quick shake at the dock solves it.
Metal
Banding, staples in quantity, and the occasional forgotten tool. Manufacturer's-joint staples are fine; loose metal is not.
Food residue
Grease and organic residue downgrade the fibre and attract a rejection. Separate at source rather than hoping.
What we will put on your site, and when it is worth it.
| Monthly OCC volume | Recommended | Why | Who services it |
|---|---|---|---|
| Under 2 tons | Gaylord collection points | A baler will never pay back at this volume | We collect on a milk run |
| 2 – 8 tons | Vertical baler | Small footprint, manual tie, low capital | Us, quarterly |
| 8 – 25 tons | Horizontal baler, manual tie | Throughput without a dedicated operator | Us, monthly |
| 25 – 60 tons | Horizontal auto-tie | Continuous feed, consistent bale weight | Us, monthly |
| 60+ tons | Auto-tie plus compactor swap | Mixed stream handling alongside OCC | Us plus your hauler |
| Seasonal spike only | Drop trailer | No capital at all — we just bring a box on wheels | Us, on schedule |
Reporting your sustainability team can actually audit.
- Tonnage reused versus recycled, monthly
- Landfill avoided, in tons and cubic yards
- CO₂e avoided, with coefficients attached
- Contamination rate per period, including increases
- EPA WasteWise and GRI 306 compatible format
- Residual fraction stated plainly, not hidden inside a percentage
What a bale is worth, and why.
Old Corrugated Containers is a traded commodity with published indices and a long history of violent swings. If you sell baled OCC without watching it, you are guessing.
| Grade | Specification | Moisture | Premium | Who buys it |
|---|---|---|---|---|
| ISRI #11 — OCC | Sorted, baled corrugated. Up to 5% prohibitives, 5% other paper. | ≤ 12% | Baseline | Domestic containerboard mills |
| ISRI #12 — Double-sorted OCC | Double-sorted, ≤1% prohibitives. New corrugated cuttings excluded. | ≤ 10% | +15 – 30% | Mills running recycled liner |
| ISRI #13 — New corrugated cuttings | Unused box plant trim, no print or wax. | ≤ 10% | +40 – 60% | High-grade liner mills |
| Mixed paper | Unsorted paper grades including corrugated. | ≤ 12% | −40 – 70% | Varies; occasionally a disposal cost |
| Wet or contaminated | Outside specification on moisture or prohibitives. | > 15% | Rejected or deducted | Nobody |
What we will put on your site, and when it is worth it.
Thresholds move with labour cost and OCC price. Below two tons a month a baler will never pay back, and we will say so rather than place one.
| Monthly OCC volume | Recommended | Capital | Why | Serviced by |
|---|---|---|---|---|
| Under 2 tons / month | Gaylord collection points | None | A baler will never pay back at this volume | We collect on a milk run |
| 2 – 8 tons / month | Vertical baler | Low | Small footprint, manual tie, low capital | Us, quarterly |
| 8 – 25 tons / month | Horizontal baler, manual tie | Medium | Throughput without a dedicated operator | Us, monthly |
| 25 – 60 tons / month | Horizontal auto-tie | High | Continuous feed, consistent bale weight | Us, monthly |
| 60+ tons / month | Auto-tie plus compactor swap | High | Mixed stream handling alongside OCC | Us plus your hauler |
| Seasonal spike only | Drop trailer | None | No capital at all — a box on wheels | Us, on schedule |
Fourteen references worth knowing by number.
Specifying packaging gets much easier once you can name the standard rather than describe the requirement. These are the ones that come up in our quotes and our customers' RFPs.
| Reference | Title | Why it matters here |
|---|---|---|
| ASTM D642 | Compressive resistance of shipping containers | The test behind box compression figures |
| ASTM D4727 | Corrugated and solid fibreboard sheet stock | Material specification for board itself |
| ASTM D5639 | Selecting corrugated box dimensions | How to specify L × W × H correctly |
| TAPPI T 811 | Edge crush test of corrugated board | The ECT number on a Box Maker's Certificate |
| TAPPI T 810 | Bursting strength of corrugated board | The Mullen number |
| TAPPI T 412 | Moisture in paper and paperboard | How moisture content is measured and deducted |
| ISTA 3A / 6 | Packaged-product performance testing | Transit simulation for parcel and distribution |
| ISO 12048 | Compression and stacking tests | International equivalent of ASTM D642 |
| FEFCO / ESBO code | International fibreboard case code | The four-digit style codes we quote against |
| ISPM 15 | Wood packaging phytosanitary measures | Why corrugated avoids an export compliance burden |
| ISRI Scrap Specifications | Recovered paper grade definitions | The #11 and #12 OCC specs we bale to |
| GRI 306 | Waste disclosure standard | The format our diversion statements fit |
| EPA WasteWise | Voluntary waste reduction reporting | Compatible reporting format on request |
| FDA 21 CFR 176 | Indirect food additives: paper and paperboard | Why used board cannot be direct food contact |
Every number we multiply by, in one table.
Take these, argue with them, substitute your own. Two have changed because a customer arrived with better data, which is the entire point of publishing them.
| Factor | Value we use | Range in literature | Note |
|---|---|---|---|
| Virgin corrugated, cradle-to-gate | 1.30 kg CO₂e / kg | 1.1 – 1.6 | Mid estimate; includes inbound freight |
| Recycled-content corrugated | 0.85 kg CO₂e / kg | 0.6 – 1.1 | Varies hugely with mill energy mix |
| Reuse cycle (collect, grade, repair, issue) | 0.215 kg CO₂e / kg | 0.17 – 0.25 | Our own measurement, trailer-allocated |
| Repair-and-reuse cycle | 0.275 kg CO₂e / kg | 0.22 – 0.33 | Adds bench labour and repair board |
| Conversion to honeycomb or dunnage | 0.49 kg CO₂e / kg | 0.4 – 0.6 | Destroys the container, keeps the sheet |
| Recycling to new board | 0.76 kg CO₂e / kg | 0.6 – 0.95 | Consumes one of the fibre's five to seven lives |
| Triple-wall gaylord board weight | 18.5 lb | 17 – 20 | 48 × 40 × 36, no lid |
| Median trips per gaylord | 9 | 4 – 14 observed | Marked-container study, n = 4,200 |
| Trailer packing efficiency | 72% | 65 – 80 | Knocked down and banded |
| Landfill density, loose OCC | 80 lb / yd³ | 50 – 110 | Used for volume-avoided figures |
We deliberately exclude end-of-life recycling credit, carbon stored in the fibre and avoided landfill methane. All three would improve our figures and all three are contested.
Reuse first — and we mean it operationally, not rhetorically
Before anything reaches our baler it passes a grading station. Containers that can be containers again are pulled out. Material that can become dunnage or honeycomb panel is routed to the press. Only what is genuinely spent gets baled, and on a typical inbound stream that is a little under two-thirds of what arrives.
This is not generosity. A container sold as a container is worth many times the same board sold as fibre, so the grading step is simply the highest-return use of a minute of labour in the building. The environmental argument and the commercial one point the same way, which is the only reason any of this survives a bad quarter.
Why contamination costs more than it looks
A mill does not price contamination proportionally. It sizes its ragger, screens and cleaners for an expected contamination rate, and exceeding that rate drops throughput rather than just adding a small cost. That is why deductions for prohibitives are steep, and why a single pallet of wax-coated produce board can downgrade an entire load rather than one twentieth of it.
Moisture is the deduction nobody budgets for
You are paid for fibre. Water arrives, gets weighed as fibre, and then has to be boiled off at the mill's expense on the drying cylinders — the single most energy-intensive step in papermaking. Mills test for it, and a bale at 14% against a 10% specification loses real money or gets rejected outright.
The fix costs nothing at most sites: move collection points under roof and never set board directly on concrete. We have watched that one change take a customer's moisture deduction to zero inside a quarter.
What a monthly diversion statement contains.
Formatted to drop into EPA WasteWise and GRI 306 reporting without your team having to re-cut the numbers.
Tonnage reused
Containers that left as containers, reported separately from recycling. These are not equivalent and should never be summed into one 'diversion' figure.
Tonnage recycled
Baled OCC by mill grade, with bale counts and average weights.
Landfill avoided
In tons and cubic yards, using 80 lb per cubic yard for loose OCC.
CO₂e avoided
With every coefficient attached so your sustainability team can substitute their own and re-run it.
Contamination rate
Per period, by material, including the periods when it gets worse. Especially those.
Residual fraction
Stated as a number with its composition, rather than rounded away inside a diversion percentage.
What comes off each machine, and how many fit a trailer.
Mills price on consistency as much as on grade. Auto-tie machines produce the most uniform bale weight, which is why they attract a better number per ton than their throughput alone would justify.
| Baler | Typical bale size | Bale weight | Bales per trailer | Note |
|---|---|---|---|---|
| Vertical, small | 60 × 30 × 48" | 500 – 800 lb | 40 – 48 | Manual tie, lowest capital |
| Vertical, large | 60 × 30 × 60" | 800 – 1,100 lb | 36 – 44 | Still manual tie |
| Horizontal, manual tie | 60 × 30 × 48" | 900 – 1,300 lb | 34 – 40 | Continuous feed |
| Horizontal, auto-tie | 72 × 30 × 48" | 1,200 – 1,600 lb | 28 – 34 | Consistent weight; mills prefer it |
| Two-ram | 60 × 43 × 48" | 1,400 – 1,900 lb | 24 – 28 | Mixed-material sites |
| Year | Market level | What drove it |
|---|---|---|
| 2019 | Low | Post-import-restriction glut; some regions near zero |
| 2020 | Rising | E-commerce surge tightened supply of recovered fibre |
| 2021 | High | Containerboard demand peak; multi-year highs |
| 2022 | Falling | Demand correction as retail inventories unwound |
| 2023 | Low to moderate | Soft demand; mill downtime |
| 2024 | Moderate | Gradual recovery, regional spreads widened |
| 2025 | Moderate | Stable; export pull supported coastal markets |
| 2026 | Moderate to firm | Inland markets lagging coastal by a visible margin |
Direction only — published indices vary by region and by mill, and inland markets have been lagging coastal ones by a visible margin. We will tell you where your region sits rather than quoting a national average at you.
Every field on a diversion statement.
Formatted so your team can lift it straight into GRI 306 or EPA WasteWise without re-cutting the numbers, and with the coefficients attached so an auditor can check them.
| Field | Unit | Frequency | Maps to | Note |
|---|---|---|---|---|
| Tonnage reused | short tons | Monthly | GRI 306-4 (diverted) | Reported separately from recycling, always |
| Tonnage recycled | short tons | Monthly | GRI 306-4 | Split by mill grade |
| Tonnage residual | short tons | Monthly | GRI 306-5 (directed to disposal) | With composition by material |
| Landfill avoided | tons and yd³ | Monthly | EPA WasteWise | 80 lb/yd³ for loose OCC |
| CO₂e avoided | kg | Monthly | Scope 3 cat. 1 and 5 | Coefficients attached every time |
| Contamination rate | % | Monthly | Internal quality | Published whether or not it flatters us |
| Trips per container | count | Quarterly | Circularity indicator | Pooled accounts only |
| Population and attrition | count and % | Quarterly | Asset reporting | With a coded reason for attrition |
| Cost per trip | currency | Quarterly | Commercial | The number that proves the programme works |
Eight claims, and how strong each one actually is.
Two of these we make and document. One we refuse to make. One we consider close to meaningless.
| Claim | Evidence needed | Strength | Caveat |
|---|---|---|---|
| Recycled content, post-consumer | Mill certificate of analysis | Strong | Percentage varies by mill and by run |
| FSC Recycled | Chain-of-custody certificate | Strong | Requires certified converters at every step |
| SFI Certified Sourcing | Chain-of-custody documentation | Strong | Covers sourcing practice, not recycled content |
| Recyclable | Material composition | Moderate | Depends on local infrastructure; wax and laminate break it |
| Repulpable | Supplier test data | Moderate | Verify with your actual recycler, not the datasheet |
| Reusable | Trips-per-container data | Strong if measured | Meaningless without a trip count behind it |
| Carbon neutral | Offset purchase | Weak | We do not make this claim and are sceptical of those who do |
| 100% diversion | Usually none | Very weak | Ask what they do with wax-coated produce board |
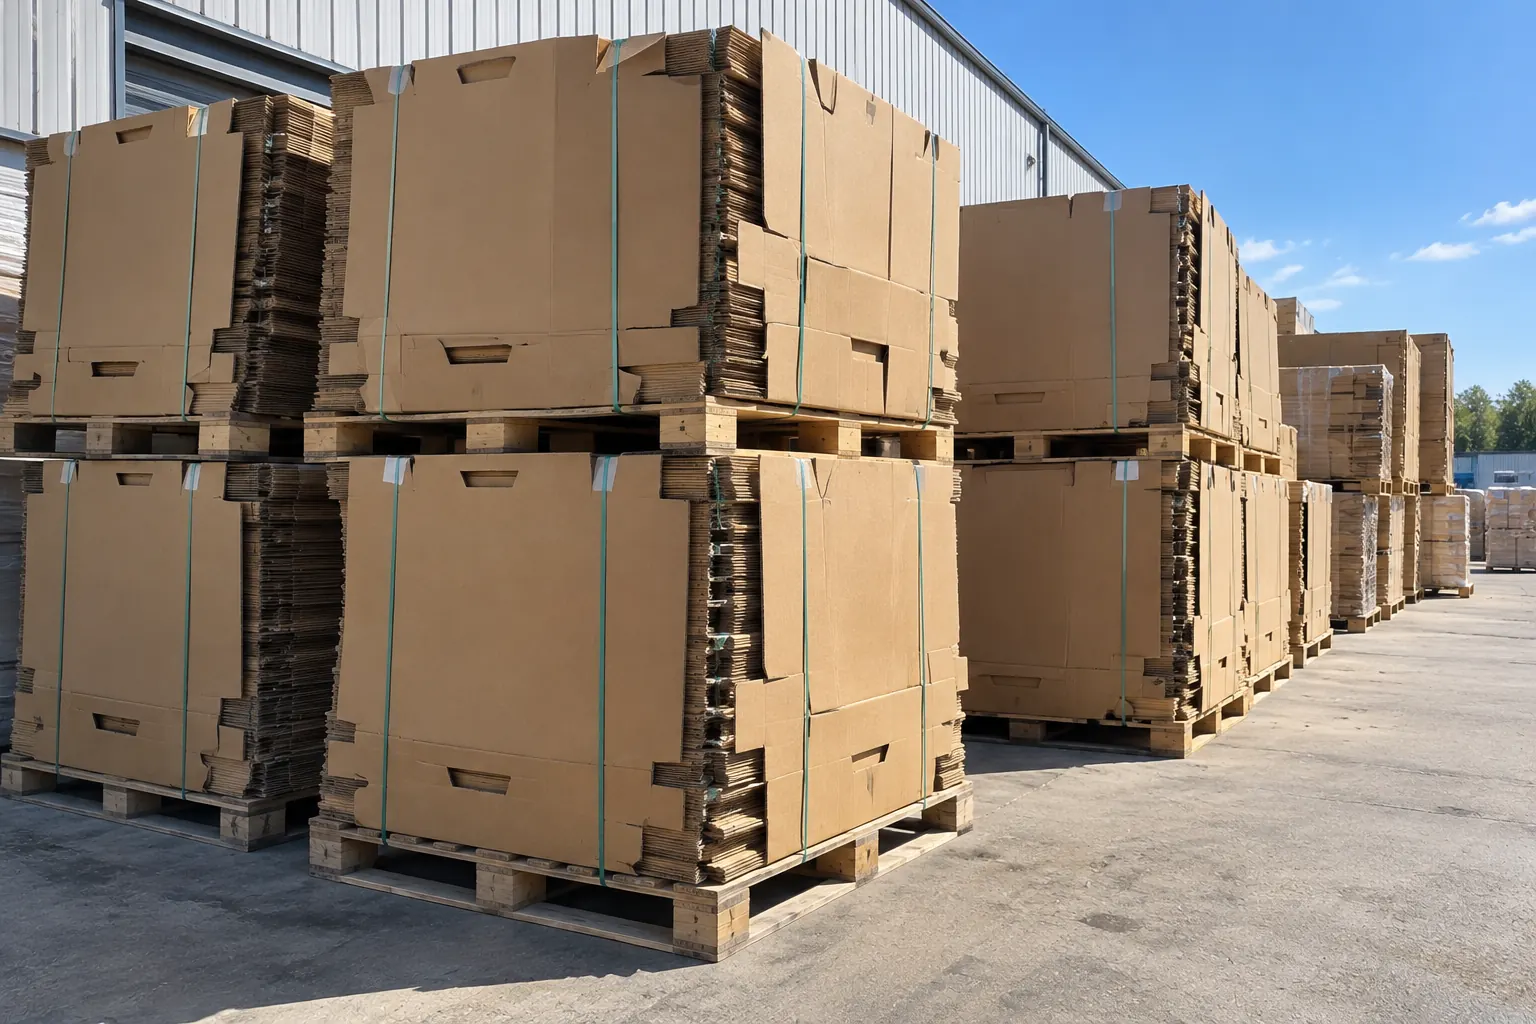
Nothing reaches the baler until a person has looked at it.
Containers that can be containers again are pulled out. Material that can become dunnage or honeycomb panel is routed to the press. Only what is genuinely spent gets baled.
This is not generosity. A container sold as a container is worth many times the same board sold as fibre, so grading is simply the highest-return use of a minute of labour in this building.