Recycling is the consolation prize. Reuse is the point.
Pulping a box back into slurry destroys most of the work that went into making it. Using it again destroys none. Everything we do is arranged around that single, slightly unfashionable fact.
Ask for the workings
Tell us what your sustainability report needs and we will send the underlying data.
End-of-life recycling credit, stored fibre carbon and avoided landfill methane are all left out of our figures. All three would improve them. All three are contested.
Four things you can do with a box, ranked by what they destroy.
This is the whole argument. Each step down the list throws away more of the embodied work in the board.
Use it again
Keeps the structure, the print, the scores, the fibre length. Costs ~1.8 kg CO₂e per cycle.
Per container cycle
Repair, then use it again
Keeps most of the structure. Adds a small amount of repair board and labour.
Per container cycle
Convert it
Destroys the container but keeps the sheet. Honeycomb, dunnage, display, upcycled goods.
Per container cycle
Recycle it
Destroys structure and shortens fibre. Still far better than landfill, and still necessary eventually.
Per container cycle
Figures are our own, allocated across a full trailer and including collection freight, grading labour and repair material. A new triple-wall gaylord carries roughly 10.9 kg CO₂e of embodied emissions before it has carried anything at all.
The fibre-length argument nobody makes
Corrugated can be recycled roughly five to seven times before the fibres become too short to form a strong sheet. Every reuse cycle postpones a recycling event. So reuse is not an alternative to recycling — it is a multiplier on it. The same tree yields more total service life.
A box reused nine times and then recycled five times has delivered forty-five useful lives. The same box recycled immediately delivers five. That is the number that should be on the front of every packaging sustainability report, and almost never is.
Why we publish bad quarters too
In 2023 our OCC contamination rate rose for two consecutive quarters after we took on a customer whose waste stream we had underestimated. We published it in the same statement as our diversion figures, lost one prospect over it, and fixed the sorting step. A figure you only share when it flatters you is marketing.
- Tonnage reused versus tonnage recycled, monthly
- Landfill avoided, in tons and cubic yards
- Estimated CO₂e avoided, with assumptions attached
- Trips per container for pooled accounts
- Contamination rate, including when it worsens
- Format compatible with EPA WasteWise and GRI 306
Run the numbers yourself
Box Studio computes the avoided carbon for any size and quantity, and shows the coefficients it used.
Every number we multiply by, in one table.
Take these, argue with them, substitute your own. We have changed two of them because customers arrived with better data.
| Factor | Value we use | Range in literature | Note |
|---|---|---|---|
| Virgin corrugated, cradle-to-gate | 1.30 kg CO₂e / kg | 1.1 – 1.6 | Mid estimate; includes inbound freight |
| Recycled-content corrugated | 0.85 kg CO₂e / kg | 0.6 – 1.1 | Varies hugely with mill energy mix |
| Reuse cycle (collect, grade, repair, issue) | 0.215 kg CO₂e / kg | 0.17 – 0.25 | Our own measurement, trailer-allocated |
| Triple-wall gaylord board weight | 18.5 lb | 17 – 20 | 48 × 40 × 36, no lid |
| Median trips per gaylord | 9 | 4 – 14 observed | Marked-container study, n = 4,200 |
| Trailer packing efficiency | 72% | 65 – 80 | Knocked down and banded |
| Landfill density, loose OCC | 80 lb / yd³ | 50 – 110 | Used for volume-avoided figures |
What a bale is worth, and why.
Old Corrugated Containers is a traded commodity with published indices and a long history of violent swings. If you sell baled OCC without watching it, you are guessing.
| Grade | Specification | Moisture | Premium | Who buys it |
|---|---|---|---|---|
| ISRI #11 — OCC | Sorted, baled corrugated. Up to 5% prohibitives, 5% other paper. | ≤ 12% | Baseline | Domestic containerboard mills |
| ISRI #12 — Double-sorted OCC | Double-sorted, ≤1% prohibitives. New corrugated cuttings excluded. | ≤ 10% | +15 – 30% | Mills running recycled liner |
| ISRI #13 — New corrugated cuttings | Unused box plant trim, no print or wax. | ≤ 10% | +40 – 60% | High-grade liner mills |
| Mixed paper | Unsorted paper grades including corrugated. | ≤ 12% | −40 – 70% | Varies; occasionally a disposal cost |
| Wet or contaminated | Outside specification on moisture or prohibitives. | > 15% | Rejected or deducted | Nobody |
Eight failure modes, coded from our own retirements.
Ordered by share of retired containers. Note how few are repairable, and how many are prevented by something that costs almost nothing.
| Failure mode | Share | Repairable? | What prevents it |
|---|---|---|---|
| Forklift tine strike, lower long panel | 31% | Rarely | Floor approach guides, full-deck pallets, slower pick-face speed |
| Moisture through the flutes | 26% | No | Pallets not concrete, covered storage, let cold trailers equalise |
| Top-edge crush | 18% | Sometimes | Telescoping lids on anything stacked or racked |
| Strapping cut at the corner | 9% | Sometimes | Corner boards — the cheapest fix on this list |
| Corner rounding from over-stuffing | 7% | No | Do not fill above the top score line; buy the taller box |
| Cracked score lines | 5% | Yes, re-score | Separate lids instead of repeatedly folded flaps |
| Manufacturer's joint failure | 3% | Yes | Prefer stapled joints over glued for reuse |
| Delamination | 1% | No | Moisture control; there is no other cause worth chasing |
Fourteen references worth knowing by number.
Specifying packaging gets much easier once you can name the standard rather than describe the requirement. These are the ones that come up in our quotes and our customers' RFPs.
| Reference | Title | Why it matters here |
|---|---|---|
| ASTM D642 | Compressive resistance of shipping containers | The test behind box compression figures |
| ASTM D4727 | Corrugated and solid fibreboard sheet stock | Material specification for board itself |
| ASTM D5639 | Selecting corrugated box dimensions | How to specify L × W × H correctly |
| TAPPI T 811 | Edge crush test of corrugated board | The ECT number on a Box Maker's Certificate |
| TAPPI T 810 | Bursting strength of corrugated board | The Mullen number |
| TAPPI T 412 | Moisture in paper and paperboard | How moisture content is measured and deducted |
| ISTA 3A / 6 | Packaged-product performance testing | Transit simulation for parcel and distribution |
| ISO 12048 | Compression and stacking tests | International equivalent of ASTM D642 |
| FEFCO / ESBO code | International fibreboard case code | The four-digit style codes we quote against |
| ISPM 15 | Wood packaging phytosanitary measures | Why corrugated avoids an export compliance burden |
| ISRI Scrap Specifications | Recovered paper grade definitions | The #11 and #12 OCC specs we bale to |
| GRI 306 | Waste disclosure standard | The format our diversion statements fit |
| EPA WasteWise | Voluntary waste reduction reporting | Compatible reporting format on request |
| FDA 21 CFR 176 | Indirect food additives: paper and paperboard | Why used board cannot be direct food contact |
What we deliberately leave out
Three credits would improve every figure on this page and all three are contested, so we exclude them: end-of-life recycling credit, carbon stored in the fibre, and avoided landfill methane. Leaving them out costs us a more impressive headline and buys us a number your sustainability team can actually defend in an audit.
Why a diversion percentage is the wrong metric
It treats reuse and recycling as equivalent, and they are not remotely equivalent. Reuse keeps the structure, the scores, the print and the fibre length at roughly 1.8 kg CO₂e per cycle. Recycling destroys the structure and consumes one of the fibre's five to seven lives, at roughly 6.4 kg.
A supplier reporting 100 per cent diversion by baling everything performs worse, environmentally, than one reporting 94 per cent while reusing a large fraction. The headline number inverts the ranking, which is presumably why it is so popular.
The test question for any supplier
Ask what they do with wax-coated produce board. Wax does not pulp and does not screen out cleanly; it redeposits on mill equipment and on the finished sheet. There are a small number of specialist outlets and they are not nationally available. Anyone claiming total diversion who cannot immediately name their wax outlet is either handling none of it or not telling you the truth.
Our residual, with its composition
- Wax-coated board — 2.4% of inbound. No viable regional outlet.
- Food-contaminated board — 1.6%. Grease contaminates the mill's water loop.
- Heavily laminated or foil-faced — 1.1%. Mixed material, not separable.
- Plastic and film from liners — 0.6%. Handled as film where volume allows.
- Miscellaneous non-paper — 0.3%. Banding, hardware, the occasional surprise.
Two of those five lines are things a dock can reduce at source, which is a far more useful conversation than a congratulatory percentage.
Where packaging shows up in your inventory.
Almost all of it is Scope 3, which is both the hardest category to influence and the one where reuse makes the largest single difference.
| Scope | Definition | Your packaging | Where we affect it |
|---|---|---|---|
| Scope 1 | Direct emissions from sources you own or control | Your own forklifts and trucks moving packaging | Our nine trailers and yard equipment |
| Scope 2 | Indirect emissions from purchased energy | Electricity for balers, compactors, lighting | Our press, baler and grading floor lighting |
| Scope 3, cat. 1 | Purchased goods and services | The embodied carbon of every box you buy | Where reuse makes the largest difference to you |
| Scope 3, cat. 4 | Upstream transportation | Freight bringing packaging to you | Reduced by knocked-down cube and reverse loads |
| Scope 3, cat. 5 | Waste generated in operations | What your dock sends to landfill or recycling | Our diversion statements report directly into this |
| Scope 3, cat. 12 | End-of-life of sold products | Where your packaging ends up after the customer | Reuse postpones this entirely |
Eight claims, and how strong each one actually is.
Two of these we make and document. One we refuse to make. One we consider close to meaningless.
| Claim | Evidence needed | Strength | Caveat |
|---|---|---|---|
| Recycled content, post-consumer | Mill certificate of analysis | Strong | Percentage varies by mill and by run |
| FSC Recycled | Chain-of-custody certificate | Strong | Requires certified converters at every step |
| SFI Certified Sourcing | Chain-of-custody documentation | Strong | Covers sourcing practice, not recycled content |
| Recyclable | Material composition | Moderate | Depends on local infrastructure; wax and laminate break it |
| Repulpable | Supplier test data | Moderate | Verify with your actual recycler, not the datasheet |
| Reusable | Trips-per-container data | Strong if measured | Meaningless without a trip count behind it |
| Carbon neutral | Offset purchase | Weak | We do not make this claim and are sceptical of those who do |
| 100% diversion | Usually none | Very weak | Ask what they do with wax-coated produce board |
Every field on a diversion statement.
Formatted so your team can lift it straight into GRI 306 or EPA WasteWise without re-cutting the numbers, and with the coefficients attached so an auditor can check them.
| Field | Unit | Frequency | Maps to | Note |
|---|---|---|---|---|
| Tonnage reused | short tons | Monthly | GRI 306-4 (diverted) | Reported separately from recycling, always |
| Tonnage recycled | short tons | Monthly | GRI 306-4 | Split by mill grade |
| Tonnage residual | short tons | Monthly | GRI 306-5 (directed to disposal) | With composition by material |
| Landfill avoided | tons and yd³ | Monthly | EPA WasteWise | 80 lb/yd³ for loose OCC |
| CO₂e avoided | kg | Monthly | Scope 3 cat. 1 and 5 | Coefficients attached every time |
| Contamination rate | % | Monthly | Internal quality | Published whether or not it flatters us |
| Trips per container | count | Quarterly | Circularity indicator | Pooled accounts only |
| Population and attrition | count and % | Quarterly | Asset reporting | With a coded reason for attrition |
| Cost per trip | currency | Quarterly | Commercial | The number that proves the programme works |
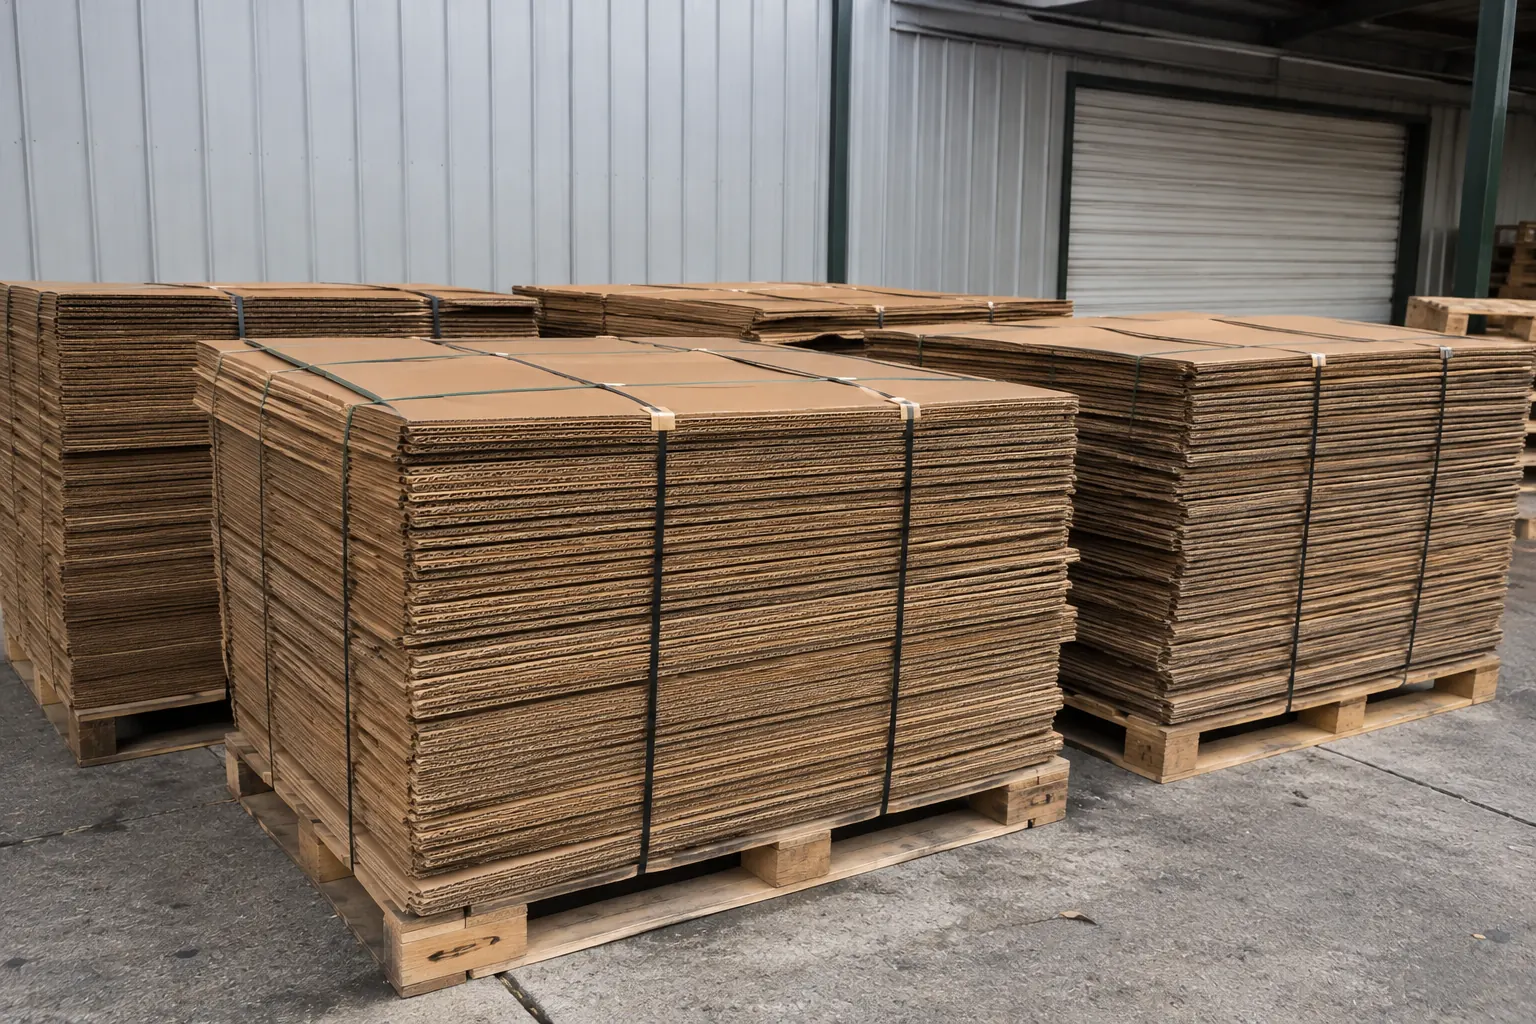
Every figure here comes off this floor.
We mark containers with a stencil in the bottom-left corner of the long panel and log every time one comes back through the gate. Median nine trips, top decile fourteen, bottom decile four.
The spread is almost entirely handling rather than board quality — which makes improving it the highest-return sustainability project most warehouses have available, requiring no capital at all.